
NOTE: updated 18 Aug 2022 with data for the Cairngorms site
On 18th and 19th July, much of western Europe, including the UK, baked in intense heat. New daily maximum temperature records were set for the UK and England (40.3°C), Wales (37.1°C) and Scotland (35.1°C) [source: Met Office].
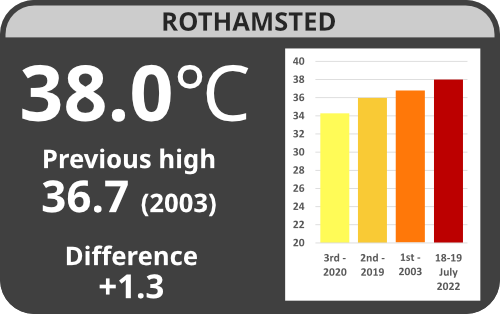
In keeping with wider observations, weather stations at most Environmental Change Network sites, in operation since the 1990s, have provisionally recorded new temperature records over the two days. The highest mean hourly temperature (38°C) was recorded at the ECN’s warmest site, Rothamsted, situated just north of London.
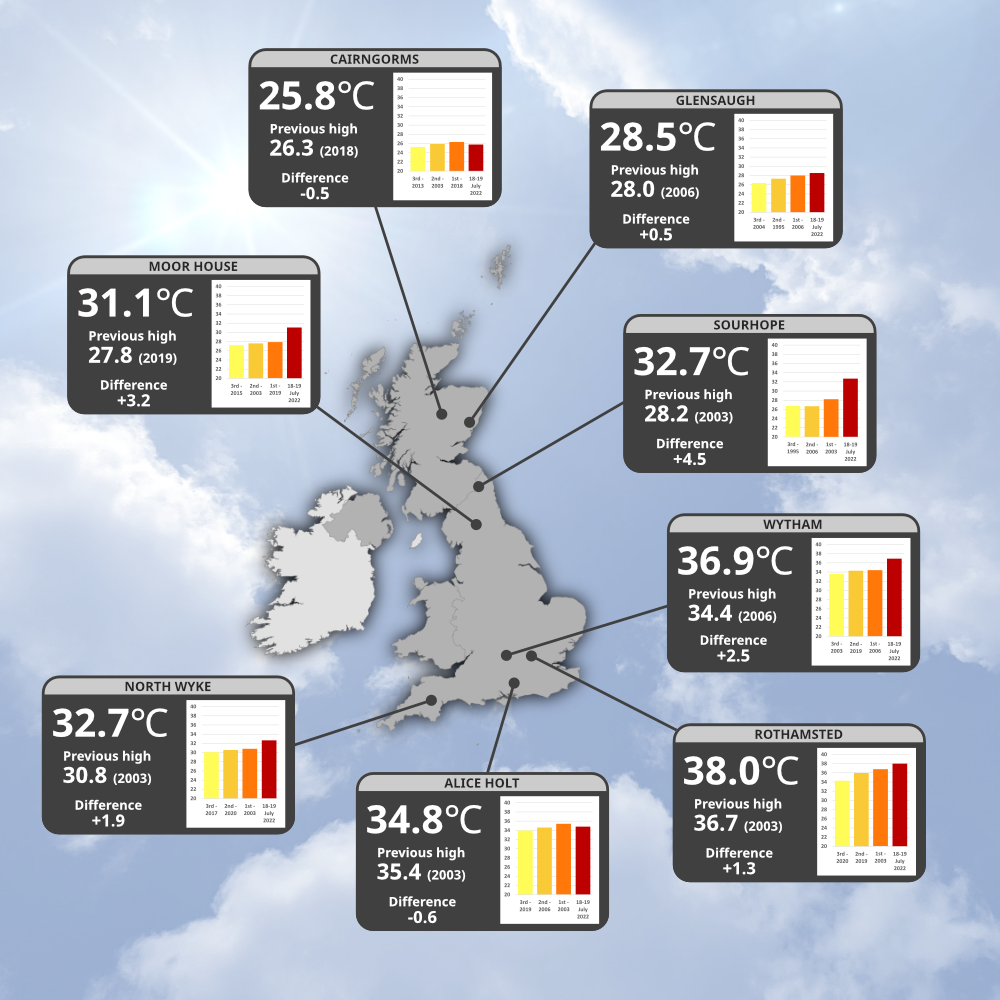
Provisional maximum hourly mean air temperatures recorded at selected ECN sites over the period 18 to 19 July. Previous highest value also shown along with the difference between the two. Charts show the previous three highest annual maximum hourly mean temperatures recorded over the duration of ECN (lighter colours) along with the July 18 to 19 maximum (red). Larger versions of the site-specific panels and a text description of the infographic are provided below).
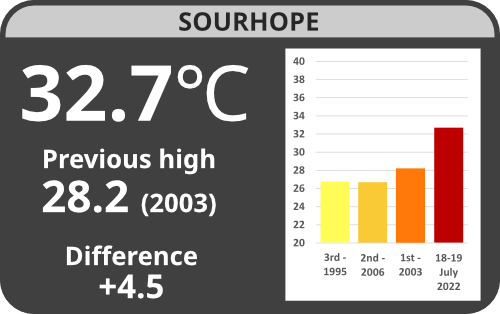
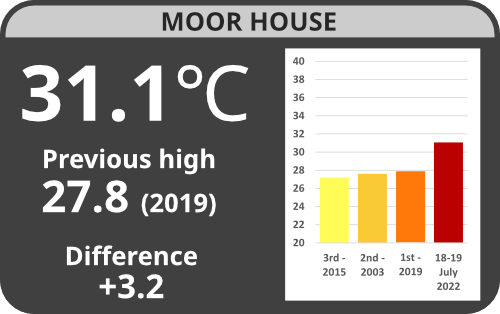
Some parts of the country saw previous temperature maxima exceeded by an extraordinary margin. For example, Sourhope, an upland ECN site in the Scottish borders recorded a mean hourly maximum of 32.7°C, 4.5°C greater than the 28.2°C experienced in 2003, while Moor House, an upland ECN site in the North Pennines broke its previous record by 3.2°C when the mean hourly temperature climbed to 31.1°C.
In general, previous temperature records were exceeded to a lesser extent at ECN sites in southern England - the greater increases in the sites in northern England / Scottish borders region perhaps reflecting an unprecedented northern extension of the heat wave.
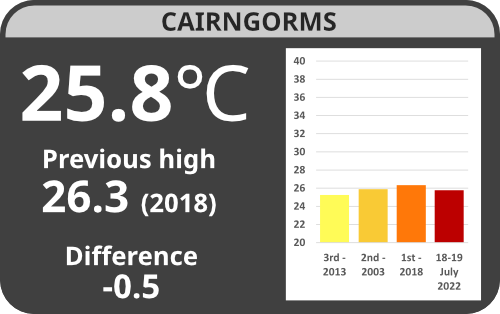
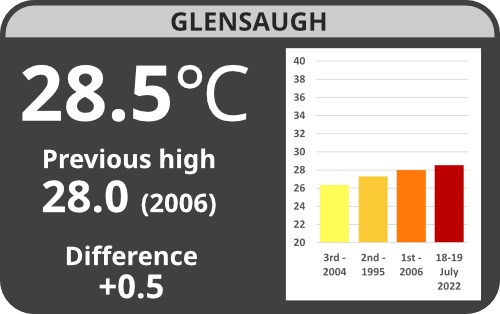
In northern Scotland, July maximum temperatures at ECN sites either exceeded the previous record more marginally (Glensaugh), or were slightly lower than the previous record (Cairngorm), indicating the northern extent of the July 2022 event.
The extreme heat was short-lived, and not sufficient, for example, to result in new records in 10 cm depth soil temperatures at ECN sites, that usually peak later in the summer. Temporary elevation in air temperatures can have acute effects on sensitive species in some circumstances, but other more time-integrated features of a warming climate that, for example, influence soil moisture or phenology (the seasonal timing of life cycle events), are often likely to exert more important influences on terrestrial ecosystem properties in the longer-term. Detailed biogeochemical and biological data gathered at these sites over the past three decades provides important opportunities to better understand the impacts of long-term environmental change on these systems.
Note: The ECN temperature values in this article have yet to be subjected to standard quality control procedures.
More detail
Provisional maximum hourly mean temperature values (°C)
| July 18-19 2022 | Previous highest value |
Difference | |
| Rothamsted | 38.0 | 36.7 | +1.3 |
| Wytham | 36.9 | 34.4 | +2.5 |
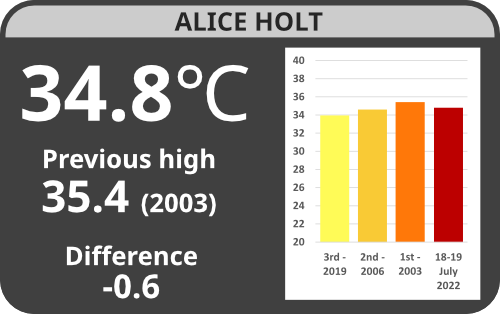
| Alice Holt | 34.8 | 35.4 | -0.6 |
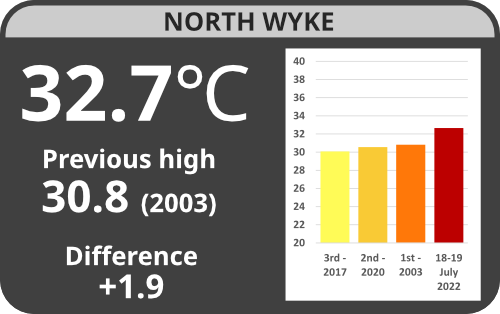
| North Wyke | 32.7 | 30.8 | +1.9 |
| Sourhope | 32.7 | 28.2 | +4.5 |
| Moor House | 31.1 | 27.8 | +3.2 |
| Glensaugh | 28.5 | 28.0 | +0.5 |
| Cairngorms | 25.8 | 26.3 | -0.5 |
 |
 |
 |
 |
 |
 |
 |
 |
Further information
- ECN terrestrial sites
- ECN meteorological recording protocol
- Tutorial: Weather, climate and climate change
[Photo: Ritam Baishya on unsplash.com]
Text description of main infographic:
Our infographic shows a map of the UK with eight Environmental Change Network sites highlighted. Panels display the temperature-related information for these sites. Values are the provisional maximum hourly mean air temperatures recorded at each site over the period 18 to 19 July followed by the previous such record high for each site, the year when this was set and the difference between the two values. Within each site-specific panel, small bar charts display the 2022 values alongside the three previous highest annual values for each site.
The text information in each panel is as follows (reading from north to south):
Caingorms (north-central Scotland). 25.8 degrees celsius. Previous record 26.3 degrees celsius in 2018. Difference -0.5.
Glensaugh (north-east Scotland). 28.7 degrees celsius. Previous record 28.0 degrees celsius in 2006. Difference +0.5.
Sourhope (south-east Scotland). 32.7 degrees celsius. Previous record 28.2 degrees celsius in 2003. Difference +4.5.
Moor House (northern England, Pennines). 31.1 degrees celsius. Previous record 27.8 degrees celsius in 2019. Difference +3.2.
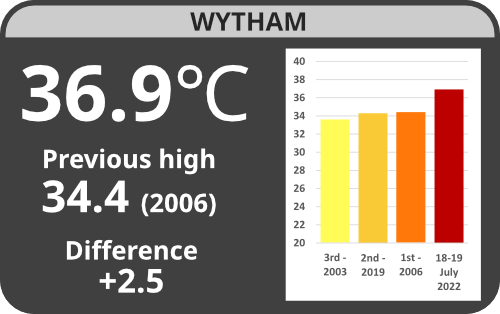
Wytham (central/southern England). 36.9 degrees celsius. Previous record 34.4 degrees celsius in 2006. Difference +2.5.
Rothamsted (south-east England). 38.0 degrees celsius. Previous record 36.7 degrees celsius in 2003. Difference +1.3.
Alice Holt (south-east England). 35.8 degrees celsius. Previous record 35.4 degrees celsius in 2003. Difference -0.6.
North Wyke (south-west England). 32.7 degrees celsius. Previous record 30.8 degrees celsius in 2003. Difference +1.9.