We've seen that climate varies in different parts of the world. Even in the UK the climate differs from one part of the country to another. The west tends to be cooler and wetter than the east, the north cooler than the south.

Temperatures decrease with altitude so the tops of hills and mountains such as the highlands of Scotland experience more snow in winter, and the snow tends to stay for longer than at lower altitude.

Although ECN doesn't yet have data spanning 30 years, you can still explore differences in climate around the UK by looking at meteorological (weather) data collected at ECN sites. See the exercise below.
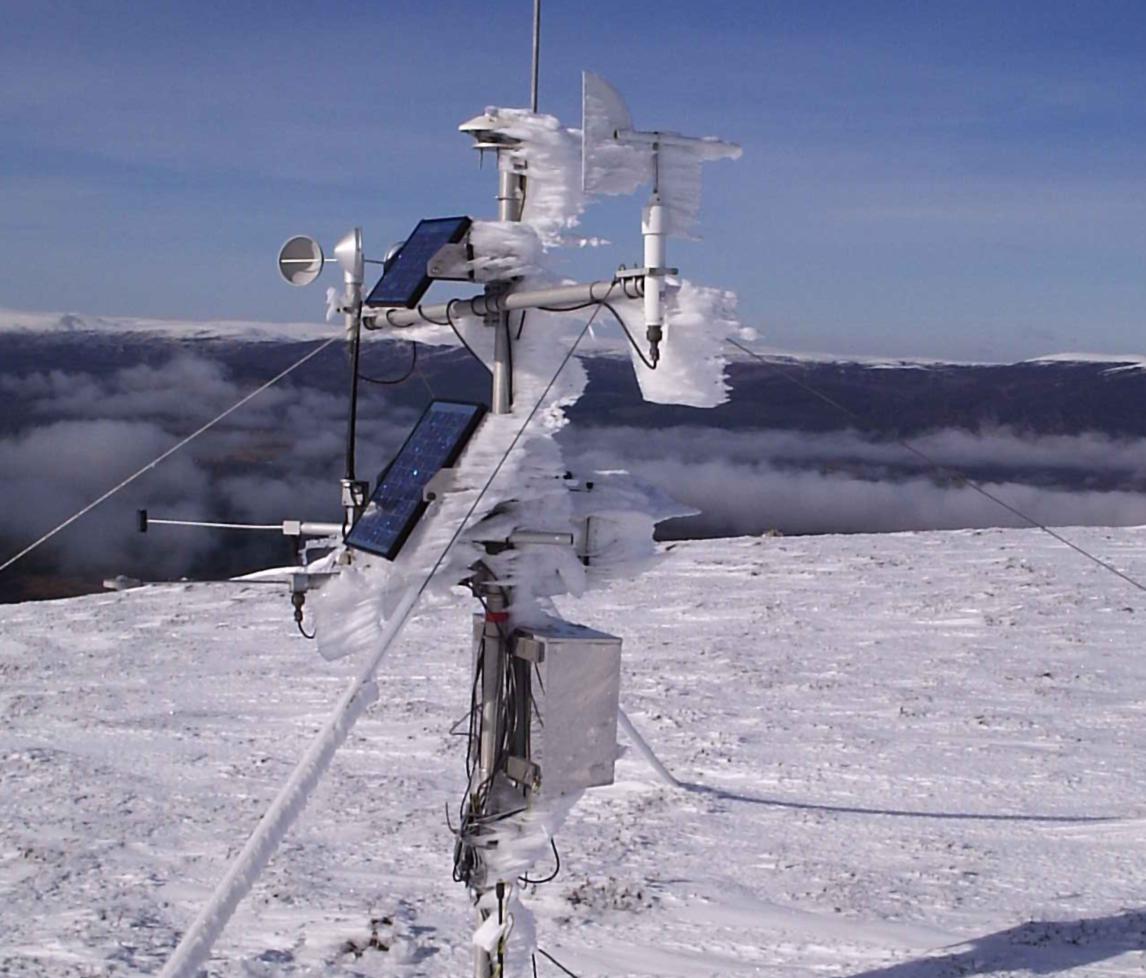
Automatic Weather Station at ECN Cairngorms covered in ice and snow
The ECN weather station high in the Cairngorms during the winter

Excercise

We are sorry, but the interactive data exploration tool required for this exercise is currently unavailable. We are working to create an alternative tool.

To look at ECN meteorological data:

  1. First, please read our conditions of data use. By clicking the link in step 2 you are confirming that you accept these conditions
  2. Accept the conditions of use and access the data
  3. Summary ECN Automatic Meteorology data are selected. A pre-selected graph of average air temperature will load. Scroll to below the graph to find options for changing the graph that is displayed
  4. Date range: Data are shown for a three year period but you can choose a different date range
  5. Variable: Air temperature is selected for you but you can choose other variables to plot, for example minimum temperature, wind speed or total rainfall
  6. Sites: We've selected three ECN sites to start with: Wytham (southern England), Moor House (northern England) and Cairngorms (northern Scotland). These sites span a wide range from south to north. You could also include two westerly sites, North Wyke (south-west England) and Hillsborough (Northern Ireland)
  7. If you make any changes, click the button to submit your changes and view the new graph that is plotted
  8. Try answering the questions below.


Questions

  • Can you see a clear pattern in the data? For example are some sites generally cooler than others?
  • Do you think any patterns are due to the location of the sites? (Note: you can see the sites on a map [Opens in a new tab] and read a description of each. Hint: choose to view ECN terrestrial sites on the map.)
  • Which variables show a clear pattern of change from site-to-site and which do not?
  • Can you see any differences between the data for summer and winter (i.e. seasonal variation)?


Conditions of data use

  • The ECN Data Centre Summary Database and its component datasets are proprietary products of NERC on behalf of the ECN Data Centre and its sponsors and thus protected by Copyright law. NERC reserves all rights of ownership and copyright in these data.
  • Users may not i) transfer, assign, rent, lease, sell, give or otherwise dispose of these data, ii) release a Product or Tradeable commodity based in whole or in part on data supplied by the ECN Data Centre, unless prior written agreement has been obtained, and any royalties due have been paid, iii) reproduce any digital or numerical data other than for back-up purposes.
  • Users are required to acknowledge the ECN Data Centre in all reference or publications which involve the use of the data. Users must offer acknowledgement and/or co-authorship of any proposed publication arising from the use of the data.  The ECN Data Centre will have the right to accept this offer, allow the user to publish in his/her own right, or refuse permission to publish, if in our judgement, the publication poses a threat to the data or the ECN Data Centre.
  • Although these data are subject to quality assurance procedures, we are not able to warrant the accuracy of any data supplied to the user, and have no responsibility for determining the fitness of the data for their intended use by the customer. The provision of such data carries no liability for its accuracy or reliability and the ECN Data Centre or its sponsors cannot be held accountable for any loss, damage, injury or any other occurrence arising from the use of these data.
  • Copies of, or a reference to, any publications which refer to these data should be sent to the ECN Co-ordinator.
  • Users and use of this interface are logged by IP address and by email address (if you log in). These statistics are used for ECN purposes only (e.g. for deriving performance statistics). All data are held in accordance with the Data Protection Act. More information is available in our data policy [Opens in a new tab].
  • This interface uses cookies to temporarily store information on your computer to enable session state between Active Server Pages. Session state is a way of remembering your choices between web pages and we use it, for example, to ensure that you only have to select the sites and measurements you are interested in once, rather than on every page you view within the interface. We do not collect any information about you except that required for system administration of the web server. These cookies automatically expire when you exit your browser. More information about cookies is available in our data policy [Opens in a new tab].